

By Charles West November 11, 2025
Business Leader Dashboards In the relentless pace of modern business, the difference between thriving and merely surviving often comes down to the speed and quality of your decisions. Gone are the days of relying solely on intuition or month-end reports that are outdated the moment they are printed. Today’s successful executives harness the power of real-time data, transforming complex information into actionable insights. The primary tool for this transformation? A set of well-designed Business Leader Dashboards. These are not just collections of charts; they are strategic command centers, providing a panoramic view of your organization’s health and trajectory.
Navigating the vast sea of data can be overwhelming. What metrics truly matter? What signals require immediate attention? The key is not to track everything, but to track the right things. This article cuts through the noise to reveal the five essential Business Leader Dashboards that every forward-thinking executive should review weekly. By consistently monitoring these core areas—Revenue, Collections, Utilization, Sales Pipeline, and Customer Health—you can foster a proactive, data-driven culture, anticipate challenges before they become crises, and confidently steer your company toward sustainable growth. These dashboards are the bedrock of informed leadership, providing the clarity needed to make strategic decisions that resonate throughout your organization.
The Strategic Imperative of Business Leader Dashboards
In an increasingly competitive landscape, data is the new currency. However, raw data is like crude oil—valuable, but useless until it’s refined. Business Leader Dashboards are the refineries of the corporate world. They process vast quantities of operational data and distill it into a clear, understandable, and actionable format. This shift from reactive, report-based management to proactive, dashboard-driven leadership is not just a trend; it is a fundamental strategic imperative for survival and growth.
The primary value of Business Leader Dashboards lies in their ability to create a single source of truth. When different departments operate from disparate data sets, misalignment and internal friction are inevitable. The finance team might be looking at recognized revenue, while the sales team is focused on new bookings. A unified dashboard ensures that everyone, from the C-suite to team managers, is looking at the same numbers and speaking the same language. This alignment is critical for executing a cohesive strategy. It breaks down silos and fosters a culture of transparency and accountability.
Moreover, effective Business Leader Dashboards are designed to highlight exceptions and trends. Instead of sifting through pages of a spreadsheet to find an anomaly, a well-designed dashboard uses visual cues like color-coding (red for a missed target, green for exceeding it) to draw a leader’s attention immediately to what matters most. This “management by exception” approach saves invaluable time and cognitive energy, allowing leaders to focus on strategic problem-solving rather than data hunting. The true power of consistent, weekly reviews of these Business Leader Dashboards is the ability to spot patterns over time, enabling more accurate forecasting and a deeper understanding of the business’s natural rhythms. Ultimately, embracing these tools is about embedding data into the very DNA of your leadership style.
The Core Five: Dashboards Every Leader Must Review Weekly
While every business has its unique metrics, a set of universal principles governs organizational health. The following five dashboards cover the critical pillars of any successful enterprise: generating revenue, managing cash, optimizing resources, building a future pipeline, and retaining customers. Making a weekly ritual of reviewing these specific Business Leader Dashboards will provide a comprehensive, 360-degree view of your business performance.
Dashboard 1: The Revenue Performance Dashboard
This is arguably the most fundamental of all Business Leader Dashboards. The Revenue Performance Dashboard provides a clear and immediate answer to the question, “How are we doing financially?” It moves beyond a simple, top-line number to dissect the sources, stability, and quality of your company’s income streams. Reviewing this weekly prevents surprises at the end of the quarter and allows for timely course correction.
Key Metrics to Track:
- Monthly Recurring Revenue (MRR) / Annual Recurring Revenue (ARR): For subscription-based businesses, this is the lifeblood. The dashboard should display not just the total MRR/ARR but also its components: New MRR, Expansion MRR (from upgrades/upsells), and Churned MRR (from downgrades/cancellations). A healthy business sees consistent growth in New and Expansion MRR that far outpaces Churn.
- Revenue vs. Target: A simple but powerful visual, this chart tracks actual revenue against your forecast or goal for the month, quarter, and year. A weekly check-in allows you to see if you are on pace, ahead, or falling behind, giving you ample time to intervene.
- Revenue by Source/Product/Region: Understanding where your money is coming from is crucial. Is a new product line taking off? Is a particular region underperforming? This breakdown helps allocate resources effectively and identify areas of opportunity or risk.
- Gross Margin: Revenue is vanity, profit is sanity. This metric shows how much profit you make on each dollar of revenue before accounting for operating expenses. A declining gross margin, even with rising revenue, can be an early warning sign of pricing pressure or increasing costs of goods sold.
A leader using this dashboard weekly can quickly diagnose the health of their revenue engine. For example, if total revenue is on target but New MRR is declining, it might signal a problem with the sales team’s effectiveness or a shift in the market. Conversely, high Expansion MRR indicates that your existing customers find value in your services and are willing to invest more, a sign of a strong product-market fit. The insights from these Business Leader Dashboards are indispensable for strategic financial planning.
Dashboard 2: The Collections and Cash Flow Dashboard
Cash is the oxygen a business needs to survive. A company can be wildly profitable on paper but fail due to poor cash flow management. The Collections and Cash Flow Dashboard provides a real-time view of your liquidity, ensuring you have the capital needed to meet payroll, pay suppliers, and invest in growth. This is one of the most critical Business Leader Dashboards for ensuring operational stability.
Key Metrics to Track:
- Days Sales Outstanding (DSO): This metric measures the average number of days it takes to collect payment after a sale is made. A high or increasing DSO means your cash is tied up in receivables, potentially straining your operations. The goal is to keep DSO as low as possible.
- Accounts Receivable (AR) Aging: This is a visual breakdown of your unpaid invoices by age (e.g., 0-30 days, 31-60 days, 61-90 days, 90+ days). A large percentage of receivables in the 60+ day buckets is a major red flag, indicating potential collection problems and an increased risk of bad debt. This part of your Business Leader Dashboards demands immediate attention.
- Cash Burn Rate: For startups and high-growth companies, this shows how quickly you are spending your cash reserves. It’s typically calculated monthly. Understanding your burn rate and your cash runway (how many months you can operate before running out of money) is essential for fundraising and financial planning.
- Operating Cash Flow (OCF): This metric shows the cash generated from your core business operations. A positive and growing OCF is a sign of a healthy, self-sustaining business. Many Business Leader Dashboards place this as a headline metric.
Weekly review of this dashboard allows a leader to be proactive about cash management. Seeing the AR Aging bucket for 61-90 days swell can trigger an immediate follow-up from the finance team. Understanding your cash runway helps you make informed decisions about hiring, marketing spend, and other investments. Ignoring these metrics is a common and often fatal mistake; diligent monitoring through dedicated Business Leader Dashboards can prevent a liquidity crisis before it begins.
Dashboard 3: The Utilization and Productivity Dashboard
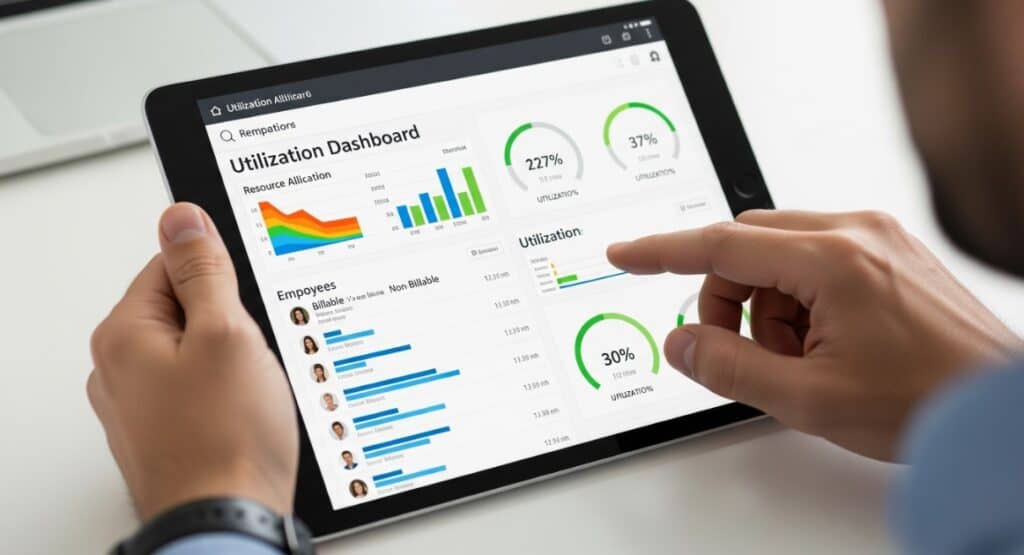
For service-based businesses—such as consulting firms, agencies, and software development shops—your people are your product. The Utilization and Productivity Dashboard is essential for understanding how effectively your most valuable resource (your team’s time) is being used. It provides insights into operational efficiency, project profitability, and team capacity. Even for product-based companies, this dashboard can be adapted to track manufacturing efficiency or engineering output. This is a powerful component of any suite of Business Leader Dashboards.
Key Metrics to Track:
- Overall Utilization Rate: This is the percentage of an employee’s total working hours that are spent on billable client work. For example, if an employee works 40 hours a week and logs 32 billable hours, their utilization rate is 80%. This is a core Key Performance Indicator for service firms.
- Billable vs. Non-Billable Hours: This chart breaks down how time is being spent across the organization. While some non-billable time is necessary (for training, internal projects, sales), an excessively high ratio can signal inefficiency or a lack of client work. Effective Business Leader Dashboards make this distinction crystal clear.
- Project Profitability/Margin: This metric goes beyond time tracking to connect utilization with financial outcomes. By comparing the revenue from a project to the cost of the employee hours spent on it, you can determine which projects—and which types of projects—are most profitable.
- Team/Individual Capacity: This helps with resource planning. The dashboard should show who is over-allocated, who is under-utilized, and who has capacity to take on new work. This prevents employee burnout and helps ensure projects are staffed appropriately.
A weekly review of the Utilization Dashboard allows leaders to make critical operational adjustments. If a highly-skilled (and highly-paid) senior team member has a low utilization rate, it’s a waste of resources. A leader can intervene to get them on a billable project or assign them to a strategic internal initiative. If project margins are consistently low, it may be time to re-evaluate pricing or project management processes. These Business Leader Dashboards directly link operational activities to the bottom line.
Detailed Team Utilization Breakdown (Example Table)
| Team Member | Role | Total Hours Logged (Weekly) | Billable Hours | Non-Billable Hours | Utilization Rate |
| Alice Johnson | Senior Consultant | 40 | 36 | 4 | 90% |
| Bob Williams | Project Manager | 42 | 25 | 17 | 60% |
| Carol Davis | Junior Analyst | 38 | 35 | 3 | 92% |
| David Rodriguez | Graphic Designer | 40 | 30 | 10 | 75% |
| Emily Chen | Practice Lead | 45 | 20 | 25 | 44% |
Note: A low utilization rate for a Project Manager (Bob) or Practice Lead (Emily) may be expected due to their overhead and sales responsibilities. The key is to compare these numbers to set targets for each role.
Dashboard 4: The Sales Pipeline and Funnel Dashboard
While the Revenue Dashboard looks at past and present performance, the Sales Pipeline Dashboard looks to the future. It provides a comprehensive view of your sales activities and helps you forecast future revenue with greater accuracy. For any business focused on growth, this is one of the most forward-looking and indispensable Business Leader Dashboards. It answers the question, “How will we make money next month and next quarter?”
Key Metrics to Track:
- Pipeline Value by Stage: This visualizes your entire sales funnel, showing the total value of deals at each stage (e.g., Prospecting, Qualifying, Proposal, Negotiation, Closed). A healthy pipeline is typically wider at the top and narrows as deals progress. An unhealthy shape, like a bulge in the middle, can indicate that deals are getting stuck at a particular stage.
- Lead Velocity Rate (LVR): This measures the month-over-month growth in qualified leads. A strong LVR is a leading indicator of future revenue growth. If your LVR is declining, your sales may decline in the coming months, even if your current revenue is strong.
- Conversion Rates (Stage-to-Stage): What percentage of leads from the “Qualifying” stage move to the “Proposal” stage? Understanding these micro-conversion rates helps you identify bottlenecks in your sales process. Improving a single conversion rate can have a massive impact on overall revenue.
- Average Deal Size & Sales Cycle Length: Are we closing bigger deals? How long does it take to close them? Tracking these metrics helps with forecasting and resource allocation. A lengthening sales cycle, for instance, might require a change in sales tactics or signal a change in the market. Well-designed Business Leader Dashboards track these trends over time.
A leader reviewing this dashboard weekly can play the role of a sales strategist. If conversion rates from “Proposal” to “Negotiation” are low, it might mean pricing is off or proposals are not compelling enough. If the total pipeline value is shrinking, it’s a clear signal to the marketing and sales teams to ramp up lead generation efforts. This dashboard removes the guesswork from sales management and provides a data-backed foundation for growth strategies. The predictive nature of these specific Business Leader Dashboards is what makes them so powerful.
Dashboard 5: The Customer Health and Engagement Dashboard
It is famously much more expensive to acquire a new customer than to retain an existing one. The Customer Health Dashboard is your early warning system for churn and your report card on customer satisfaction and loyalty. It shifts the focus from a purely transactional view of business to a relational one, which is key for long-term, sustainable success. In the subscription economy, this is a non-negotiable part of your weekly Business Leader Dashboards review.
Key Metrics to Track:
- Net Promoter Score (NPS) / Customer Satisfaction (CSAT): These survey-based metrics gauge customer loyalty and satisfaction. NPS asks how likely a customer is to recommend your product/service, while CSAT measures satisfaction with a specific interaction. Tracking the trend over time is more important than any single number.
- Customer Churn Rate: This is the percentage of customers who cancel or fail to renew their subscriptions over a given period. It should be broken down into Customer Churn (number of customers lost) and Revenue Churn (MRR lost). High churn is a leaky bucket that can sink a business, no matter how good your sales team is.
- Customer Lifetime Value (LTV): This metric predicts the total revenue your business can expect from a single customer account throughout your relationship. A high LTV indicates that you are retaining customers and they are continuing to find value over time.
- Product Usage/Engagement Metrics: For software and tech companies, tracking how customers are using your product is a powerful indicator of health. Are they using key features? How often do they log in? A drop-off in usage is often a leading indicator of potential churn. Integrating this data into your Business Leader Dashboards provides deep, proactive insights.
By reviewing this dashboard weekly, a leader can get ahead of customer issues. A dip in NPS can trigger a deep-dive analysis to understand the root cause. If a key account shows a sudden drop in product engagement, the customer success team can reach out proactively before the customer even considers leaving. These Business Leader Dashboards help you build a customer-centric culture, turning satisfied clients into loyal advocates who drive referrals and expansion revenue.
Beyond the Big Five: Ancillary Dashboards for Deeper Insights
While the core five dashboards provide a comprehensive weekly overview, certain functions merit their own detailed views. Once you have mastered the weekly review of the essentials, integrating these ancillary Business Leader Dashboards can provide even greater strategic depth.
The Marketing ROI Dashboard
This dashboard connects marketing spend to business outcomes. It answers the crucial question: “Are our marketing dollars generating a positive return?” Instead of relying on vanity metrics like ‘likes’ or ‘impressions’, this dashboard focuses on tangible results. Key metrics include Customer Acquisition Cost (CAC), the LTV to CAC Ratio (a healthy business model typically has a ratio of 3:1 or higher), and lead-to-customer conversion rates by channel. This allows leaders to double down on high-performing channels and cut spend on those that aren’t delivering, optimizing the marketing budget for maximum impact. A suite of comprehensive Business Leader Dashboards should always connect spend to revenue.
The Operational Efficiency Dashboard
This dashboard is focused on the internal processes of the business. For a manufacturing company, this might include metrics like inventory turnover, production uptime, and order fulfillment time. For a tech company, it could track server uptime, bug resolution times, and software deployment frequency. The goal is to identify and eliminate bottlenecks, reduce waste, and streamline operations. Improving operational efficiency can have a direct impact on gross margins and customer satisfaction, making this a valuable addition to your set of Business Leader Dashboards.
Implementing and Optimizing Your Business Leader Dashboards
Simply having Business Leader Dashboards is not enough; they must be implemented thoughtfully and integrated into the fabric of your company’s operating rhythm to be effective.
Choosing the Right Tools and Technology
The market is filled with powerful Business Intelligence (BI) and dashboarding tools like Tableau, Power BI, Google Data Studio, and countless industry-specific solutions. The right tool for you depends on your budget, technical expertise, and existing data sources. The key is to select a platform that can connect to all your critical data (CRM, accounting software, project management tools) and is user-friendly enough for non-technical leaders to explore the data themselves. The initial setup of your Business Leader Dashboards is a critical investment.
Fostering a Data-Driven Culture
The most advanced Business Leader Dashboards are useless if they are ignored. Leadership must champion a data-driven culture. This means starting every weekly leadership meeting by reviewing the core dashboards. It means asking “What does the data say?” before making a key decision. When team members see that data is central to how performance is measured and how decisions are made, they will begin to adopt the same mindset. Accountability is key; each metric on a dashboard should have a clear owner responsible for its performance.
The Art of Interpretation: From Data to Actionable Insights
The final and most crucial step is turning data into action. A dashboard might show that customer churn has increased by 2%. The data itself is just a number. The insight is the why. Is it because of a recent price increase? A new competitor? A buggy product release? A great leader uses the dashboard as a starting point for inquiry. They drill down, ask questions, and collaborate with their team to understand the story behind the numbers. The weekly review should conclude with a clear set of action items: who is going to do what by when to address the trends revealed by the Business Leader Dashboards. This cycle of data -> insight -> action is what drives continuous improvement and sustained success.
Conclusion: Weaving Data into Your Leadership DNA
In a world of constant change and immense complexity, clarity is a leader’s greatest asset. The five essential Business Leader Dashboards—Revenue, Collections, Utilization, Sales Pipeline, and Customer Health—provide precisely that. They are not merely reporting tools; they are strategic instruments for navigating the challenges and opportunities your business faces every day.
By committing to a weekly review of these dashboards, you replace ambiguity with certainty, speculation with strategy, and reaction with proaction. You create a unified language of performance that aligns your entire organization around the metrics that matter most. The consistent use of these Business Leader Dashboards will transform your leadership, enabling you to make faster, smarter, and more confident decisions. They are the foundation upon which you can build a resilient, efficient, and high-growth organization, ensuring you are not just keeping pace, but setting it.
Frequently Asked Questions (FAQ)
1. How often should I really be checking these Business Leader Dashboards?
While real-time access is beneficial, a dedicated, in-depth review should be conducted weekly. This cadence is frequent enough to catch trends and issues before they become critical but allows enough time to pass for meaningful patterns to emerge. A weekly leadership meeting centered around these dashboards is a highly effective practice.
2. Can I combine all of these metrics into one master dashboard?
Yes, it is possible to create a “master” executive dashboard that shows one or two headline KPIs from each of the five core areas. However, it’s crucial to also maintain the separate, more detailed Business Leader Dashboards. The master dashboard is for a quick, at-a-glance health check, while the individual dashboards are for the deeper analysis and problem-solving required during your weekly review.
3. What is the single biggest mistake leaders make with Business Leader Dashboards?
The biggest mistake is “analysis paralysis” or “vanity tracking.” This involves either creating dashboards with too many metrics, leading to an inability to focus, or focusing on vanity metrics (e.g., website traffic without context) instead of actionable metrics (e.g., lead conversion rates). The key is to be ruthless in your selection of KPIs, ensuring each one is directly tied to a strategic business objective.
4. How do I get started if my company currently has no formal dashboards?
Start simple. You don’t need a sophisticated BI tool on day one. Begin with a single dashboard, likely the Revenue Performance Dashboard, and build it in a spreadsheet. Identify your 3-5 most critical revenue metrics, pull the data manually, and update it weekly. The discipline of the process is more important than the technology at the beginning. Once you prove the value and build the habit, you can invest in more advanced tools to automate and expand your Business Leader Dashboards.
5. Are these five dashboards relevant for a non-profit or a very small business?
Absolutely. The underlying principles are universal, though the specific terminology might change. A non-profit can track a “Donations & Grants Dashboard” (Revenue), a “Pledge Fulfillment Dashboard” (Collections), a “Program Staff Utilization Dashboard,” a “Donor Pipeline Dashboard,” and a “Beneficiary/Donor Satisfaction Dashboard.” A small business owner needs these insights more than anyone to manage scarce resources effectively. The core concepts of managing income, cash, resources, future opportunities, and stakeholder satisfaction apply to any organization.